
I’m excited to announce that Riex package is now available on CRAN! and you can install using:
install.packages("Riex")
Introduction
Main purpose of RIEX is to efficiently and reliably retrieve stocks and market data via IEX Cloud API. Platform is offered by Investors Exchange Group – IEX Group. To subscribe, visit: IEX Cloud
First Riex release includes basic functions that retrieve data in a standard format – e.g. Data frames. Future releases are expected to:
- Leverage
Rcapabilities including existing packages to effectively provide financial and statistical analysis as well as visualization. - Use
Reticuate– anRpackage that interface with Python modules, classes and functions to further enhance the capability to process and analyze data. - Optimize code to retrieve data for multiple symbols.
- Add the functionality to store and retrieve data from AWS S3
Get Started
Secret Key/ Token is required for all API callS. It is available via Account Console and assigned the variable sk in the documentation. e.g. sk <- “sk_…”.
Keep your Secret Token safe. Your Secret Token can make any API call on behalf of your account, including changes that may impact billing such as enabling pay-as-you-go charges.
For more details about best practices to store and encrypt Secret Key/ Token check Managing secrets by Hadley Wickham
Load Package
library(Riex)
Assign valid values to key parameters:
- sk <- “[SECRET KEY]”. e.g. sk <- “sk_…”
- x <- “TSLA”
- r <- “1y”
Examples
Account usage details
iex.key.usage()
usage <- iex.key.usage(sk)
print(usage)
Time series – OHLC
TSLA <- iex.chart(x, r, sk)
Use quantmod package for visualization
library(quantmod)
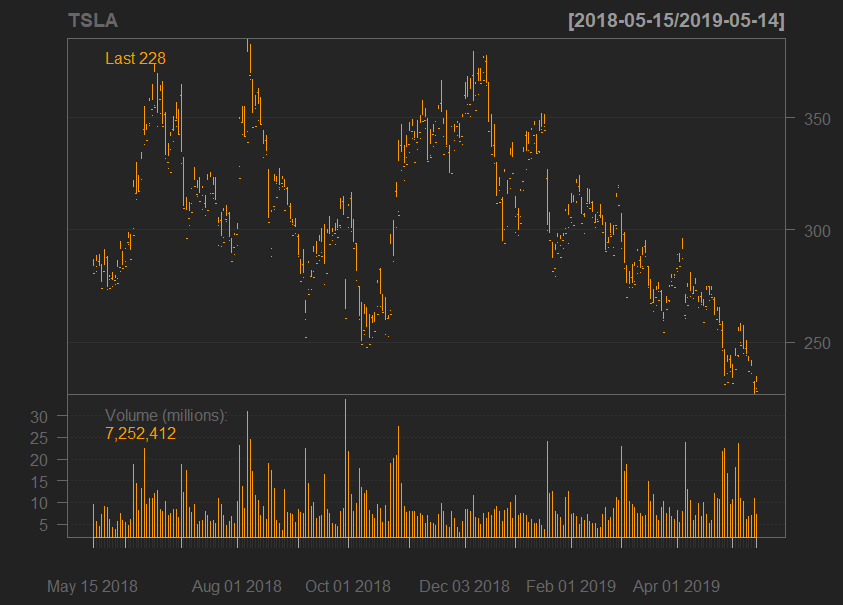
Generate Barchart
barChart(TSLA)
To check available themes to customize visualization
names(quantmod:::.chart.theme)
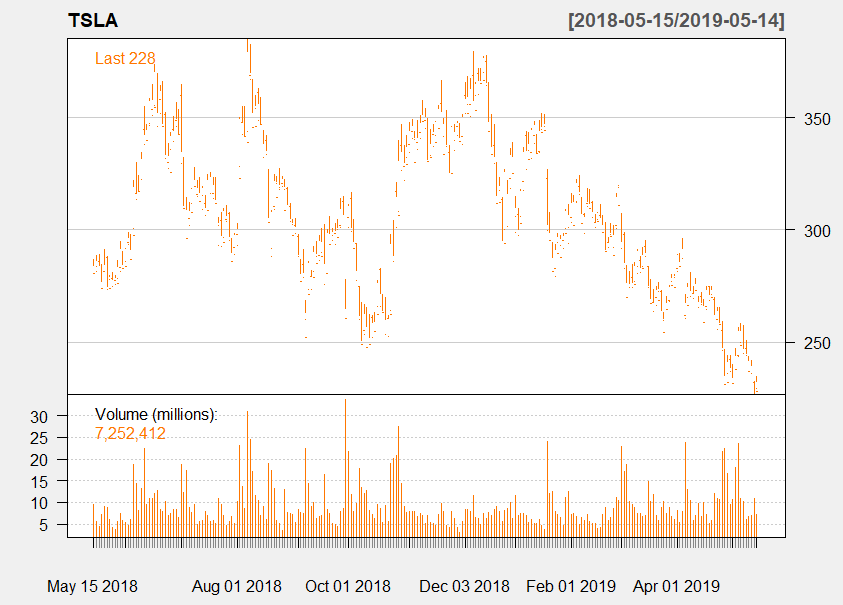
To apply a different Theme
barChart(TSLA, theme="white")
chartSeries(TSLA)

To create an interactive chart for multiple stocks
Credit: Chris Bow
- Retrieve OHLC data
TSLA <- iex.chart("TSLA", r, sk)
GM <- iex.chart("GM", r, sk)
head(TSLA)
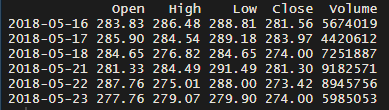
To view top records in time series for TSLA
- Merge data for both stocks
stocks <- cbind(TSLA$Close, GM$Close)
- Change columns names to specify close by symbol
colnames(stocks) <- paste0(c("TSLA", "GM"), ".Close")
- Load the following packages
library(dygraphs)
library(dplyr)
- Get the first and last date
start(stocks)
[1] “2018-05-16”
end(stocks)
[1] “2019-05-15”Setup chart
stocks_chart <- dygraph(stocks, main = "TSLA & GM Closing Price - 1 Year") %>%
  dySeries("GM.Close", axis = "y2") %>%
  dyAxis("y",
         label = "TSLA") %>%
  dyAxis("y2",
         label = "GM",
         valueRange = c(20, 50),
         independentTicks = TRUE) %>%
  dyRangeSelector(dateWindow = c("2018-05-16", "2019-05-15")) %>%
  dyRoller()
Display Interactive Chart in Viewer pane
stocks_chart

To save in html format and display in browser, following are the steps:
Install and load htmlwidgets
install.packages("htmlwidgets")
library(htmlwidgets)
saveWidget(stocks_chart,
           "stocks_chart.html",
           selfcontained = TRUE)
Conclusion
IEX Group mission “We’re building fairer markets.” is the motivation for this project and certainly hope to continue supporting their effort and bring value to the community. There has been significant enhancements since launching IEX Cloud API which makes this project really exciting!!
Your feedback and suggestions will be key to continuously improve Riex so it becomes relevant and practical to use. Looking forward to feedback and suggestions.. To report any issues or share your pull request, visit GitHub
